

Kroger officials know their business, but describing it is another thing.
“The grocery industry as we all grew up in: It doesn’t really exist anymore,” David Dillon, Kroger’s chief executive officer, said earlier this month during a conference call with financial analysts. “We’ll occasionally use the term ‘grocery’ because it helps us relate to the things you describe. … But we don’t think of that as our industry. We don’t have a good name for it other than ‘food,’ but it’s a broader industry than the traditional food industry.”
Dillon’s remarks came during a lengthy response to a question posed by a financial analyst: How, Dillon was asked, was Kroger managing to navigate challenges to the supermarket channel better than its peers? Dillon replied by saying Kroger’s focus was not on what was good for the supermarket industry necessarily, but on what was good for Kroger’s customers. And that, he said, is what’s good for Kroger.
 “Instead of looking at traditional supermarkets, we look at the pie being a lot bigger than that,” Dillon explained. “We are looking … at where our customers spend their money. And because we look at it that way, our battle has been for market share of that bigger pie. And that attitude, that viewpoint, caused us to address it differently than other supermarket operators.”
This focus on the customer — within the wide field of dynamic retail channels — is key to understanding Kroger’s point of view and its moves toward store format evolution, investments in technologies, product selections and pricing strategies. Kroger is not insulated from challenges unique to the supermarket industry, but the company firmly believes its perspective places it in a channel unto itself.
“People look at Kroger incorrectly probably, because they try to put people into channels,” added Mike Schlotman, Kroger’s chief financial officer, in the same exchange. “If you look at what a traditional supermarket would be, and you go into our stores today, it’s nothing like it used to be. And there really is a new category that we’re in. … What we’re trying to create with our customers is a channel that’s completely different than anything that’s out there. And I think our customers are showing us … that’s really happening.”
If Kroger is to be confined to the grocery channel, understand that it’s performed like no one else in it. Its fourth-quarter financial results posted this month marked the 33rd consecutive quarter of increased non-fuel identical sales. And while its earnings results aren’t going to blow away Wall Street at least while Whole Foods is around, Kroger officials insist that its “Customer First” strategy will reward shareholders as a result of its impressive gains in sales and share.
“I wouldn’t say that Kroger is its own channel, but they’ve certainly set themselves apart from the rest of the channel,” Mike Paglia, senior analyst for Kantar Retail, Cambridge, Mass., told SN. “We project them accounting for 25% of the growth in the channel over the next five years. They’re a leader by a wide margin.”
 Kroger didn’t always have a name for its strategy either. Although the company has been funding price and service investments through cost reductions and relying on analysis from shopper card data and other consumer research for more than a decade, officials didn’t use the term “Customer first” widely until 2008, when it laid out the strategy behind what it called four key elements: Price, Products, People and Shopping Experience. A combination of these elements make Kroger’s strategy a difficult for competitors to replicate and can produce results within a variety of economic conditions.
“It’s not any one of them,” Dillon said. “It’s the four of them.”
Dillon insists this point of view will also lead to better earnings growth over the long run, saying Kroger’s performance before undertaking this strategy in 2001 provides the best example.
“If you look at ourselves in the 1990s, even though we had good earnings growth during that time, our sales were not strong, we were losing relevancy with customers, and we were really focused on just producing earnings,” he said. “When we moved to a point of view that said, we’ve got to solve issues for customers, put customers first, that, in effect, gave us a stronger result for our shareholders.”
Kroger officials weren’t available for comment for this article, but public remarks as well as observations from industry analysts suggest an almost religious devotion to its strategy and an admiration for sticking to it even when alternatives could be argued.
“The great thing you can say about them is they have been steadfastly consistent,” Neil Stern, senior partner of McMillan Doolittle, Chicago, told SN. “They said, ‘Here’s our strategy, here’s what we are trying to do,’ and they have stuck to it. In good economic times, in bad economic times, they have stuck with it. They don’t seem to pay too much attention to the analysts on a quarterly basis [but] you see that consistency in results coming through.”
Although financial analysts have generally agreed that Kroger over the last decade has been the strongest performer among traditional food retailers, they are often cautious in their praise, citing Kroger’s propensity to sacrifice profits in price investments and concern for the ability to hold up sales in tough economic times.
Gary Giblen, an industry analyst, has long likened Kroger’s balance of sales and earnings growth to a tightrope walk. Ajay Jain, an analyst for Cantor Fitzgerald, in a recent investment thesis noted earnings and sales trends had deteriorated since 2009 and that Kroger’s strategy produced choppy results.
“While it’s long been viewed as the best-positioned conventional retail operator overall (a view we strongly agree with), we also believe that Kroger’s financial performance has also been somewhat inconsistent since [fiscal 2009],” Jain said. “Management’s single-minded focus on customer loyalty has at times come at the expense of earnings growth (many times, in an unpredictable manner).”
Kroger officials say their business model is structured so as to produce annual earnings per share growth in the 6% to 8% range, plus a dividend of 1.5% to 2% annually for a total return of 8% to 10%. This, Schlotman said, compares favorably to the S&P 500 over a rolling three-to-five-year period, and is generally less volatile than most S&P 500 stocks. Earnings growth is sparked by identical-sales gains plus small improvements in margin.
Customer First
The Customer First strategy is designed to reward Kroger’s best and most profitable shoppers, through a loyalty program producing what officials call unique customer insights. Kroger’s store base and geographic diversity is such that today 50% of U.S. households carry one of Kroger’s loyalty cards. Around 90% of the company’s $90.4 billion in sales in fiscal 2011 were made by customers using a Kroger loyalty card.
Kroger crunches data from its card shoppers with the help of Dunnhumby USA, a division of the London-based loyalty firm (Kroger holds a 50% ownership stake in Dunnhumby USA, which like Kroger is headquartered in Cincinnati). The data go toward the generation of personalized coupons — known as Loyal Customer Mailers or LCMs — that officials say are highly relevant and frequently redeemed.
Using his own family’s shopping patterns as an example, Schlotman in a presentation earlier this month described how LCMs deliver precise offers with room for nuance that might seem counterintuitive.
 “Everybody knows what I make for a living, because the SEC gives me the pleasure of putting that in our proxy,” Schlotman explained. “And people could infer from that that I must be a premium kind of customer and not very price sensitive.”
In fact, he explained, shopping patterns detected by Dunnhumby suggest the Schlotmans were “spending splurge/saving splurge” shoppers, who tended to consistently buy some items they like, such as vegetables, but only buy other items — such as enhanced waters — at particular price points.
“When I get my quarterly mailings from Dunnhumby, just like any other customer does, it’s amazing how close they are to things that excite my wife and I about exactly how we shop,” he said. “So generally speaking, I get coupons for products we’re interested in saving a little bit vs. splurging on. … And we do that customer by customer.”
That program is critical to building customer loyalty over time, but there’s more to it than that. Dunnhumby also allows Kroger to detect changes in the market and measure results — good and bad — of its sales efforts quickly. This helps Kroger feed what officials call the “virtuous circle of value creation” — investing leverage from sales into the customer experience, leading to greater sales.
“The thing that’s so magical about this cycle is that with the help of Dunnhumby, when you do something and it works, you do more of it,” Rodney McMullen, Kroger’s president and chief operating officer, said during an investor presentation. “When something you do doesn’t work, you stop doing it. As a retailer, it’s always difficult to stop doing the things you invented. But Dunnhumby makes it really easy because it just kind of hits you in the face.”
Key Elements
Kroger pulls multiple levers to create a positive price impression but stops short of being a “price leader.” This mixture includes everyday prices, weekly specials, a three-tiered private-brand selection and the previously mentioned personal deals to create a price image capable of resonating with shoppers in good times and bad. It leans on its other key elements — the shopping experience, product variety and quality, and customer service — to command premiums, officials said.
“Kroger is all about a cocktail of different things that makes their success very hard to attribute to one particular thing or another,” Mark Heckman, a Bradenton, Fla.-based principal with Mark Heckman Consulting and a former competitor of Kroger at retailers including Marsh and Randalls, told SN. “But one thing they’ve always had is strong price imagery; they’ve been able to basically pull gross margin out of their stores and be able project a price image advantage over most all of their conventional competitors in the market. It was always difficult to maintain price parity with them [as a competitor], even when our surveys would indicate we were close.”
Kroger listens to suppliers, customers and its sales data to know when its time to adjust prices, then endeavors to make the change resonate by engaging each of its key brand elements. Such a change took place in revamped produce departments throughout the chain in recent years.
It began when sales data showed produce missing from too many shopping carts and surveys indicated low-cost providers were doing it better, officials said. In addition to lowering everyday prices on items appealing to its price-sensitive shoppers, Kroger responded to other shoppers demanding local selections and better variety with new displays and signage to highlight variety. It also trained associates to keep produce departments attractive and well-stocked. The effort resulted in double-digit tonnage increases in produce, officials said.
 Customer surveys tracking the progress of Kroger’s Customer First metrics say the company is steadily improving in each of the four areas starting from a base in 2006, McMullen said. According to its most recently reported statistics, price perception was up by 20%, shopping experience improved by 10.9%, people scores improved 12.1% and product scores improved 8.5% since 2006, McMullen said.
“If you think about where we were when we started this journey, you’d go into a Kroger store and basically, they were all the same. We treated all customers the same. It didn’t matter whether you were a loyal customer spending $5,000 a year or a customer spending $50 a year: We treated you the same. We were kind of in the middle,” McMullen said. “Since then we’ve been separating away from the middle, making sure our great customers are treated like great customers and segmenting our stores and our approach to those customers based on what they tell us.”
Kroger is also applying technology to its four keys, making progress on a variety of fronts including digital coupons and checkout speed. Kroger’s IT efforts focus on basics such as building reliable data platforms and tools to help shoppers and employees but also focus on what Christopher Hjelm, the company’s chief information officer, described as “pretty innovative things that we believe can rewrite the rules for retail.”
One such project is the proprietary “scan tunnel” technology known as Advantage Checkout, which utilizes a tunnel with scanning cameras at 360 degrees that can scan items as fast as they can be placed on the belt. The custom-built technology debuted at a Kroger Marketplace store in Hebron, Ky., in 2010.
According to Hjelm, the development grew from a discussion of Kroger customers spending a lot of time struggling to properly scan things at self-checkout. “Billions of times a year, people were performing a task that doesn’t create much value,” he said.
Advantage Checkout has been improved since its debut, including the ability to scan stacked items and detect “overlabeled” items, a Kroger spokesman said. The company is now beginning to engage other retailers in the technology to benefit from the patent — and eventually, the benefits of widespread consumer acceptance.
Kroger in the meantime has used a combination of labor-scheduling technology and employee training to make a significant impact in wait times in checkout without the scan tunnel.
“The average wait time is now under 40 seconds and trending down to 30 seconds. So when you look to five or six years ago before we did anything at the front end, the customer may wait six to eight minutes to get their first item scanned, it’s now under 40 seconds. And we’ve done it without any more labor,” Schlotman said this month.
Faster checkouts — a theme Kroger is now promoting in regional television advertising campaigns — can have far-reaching effects on customer satisfaction. For example, Schlotman said, faster turnover is having the effect of making parking lots at Kroger stores bigger, because each car is in the lot for less time.
“Kroger a few years ago was pretty much in the middle of the pack on any service or operational metrics, and so any improvement they can make in those areas would be just one more element allowing the customer to say, ‘Kroger is the place where I do most of my shopping,’” Heckman said. “If it’s not the best experience — not a Fresh Market or Wegmans experience — it’s at least better than I used to have at Kroger. And often those kinds of incremental gains are enough to make the numbers move.”
Paglia of Kantar Retail said such improvements are the engine that keeps Kroger’s same-store sales momentum chugging along, noting that its eight-year streak of increased same-store sales have come without a marked increase in its number of stores.
“They’re able to leverage their existing store portfolio and increasingly ramp up the productivity with a flat to shrinking store base. To continually get existing stores to work harder and be more productive is their biggest contributor to their overall growth and it goes back to a really strong operating model running in the background.”
Kroger has recently tweaked its capital expenditure allocation so as to fund the most impactful new stores and expansions companywide first, rather than leaving such decisions to local operating divisions, Schlotman said. This will assure Kroger will build “truly outstanding stores,” he said. The company plans between 30 and 40 new projects a year and annual cap-ex spending of around $2 billion.
Kroger by the Numbers
35% Private-brand grocery unit sales, 2011
27% Grocery sales dollars from private brands, 2011
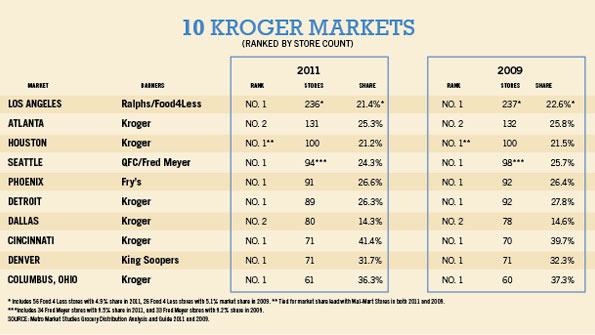
+0.5% Kroger’s overall share of products sold in its markets in 2011
33 Consecutive quarters of positive non-fuel identical-store sales
$90.4 Sales in billions, 2011
2,435 Supermarkets and multi-department stores
339,000 Employees
Trimming Gross Margins
(Kroger’s gross margins as a % of sales for each fiscal year)
2001: 27.4%
2002: 26.9%
2003: 26.4%
2004: 25.4%
2005: 24.8%
2006: 24.3%
2007: 23.7%
2008: 23.9%
2009: 23.2%
2010: 22.3%
2011: 21.0% (est.)
2012: 20.5% (est.)
2013: 19.9% (est.)
Source: Kroger reports, Cantor Fitzgerald estimates