
Climbing retail prices contributed to sales gains and volume losses for many of the fresh food categories featured in our annual guide over the latest 52-week period. The protein categories’ prices in particular have been impacted by limited availability and high feed costs. Another year of rising meat prices brought sales gains, although they were smaller than last year’s.
There were some standout fresh categories this year, whose growing sales can be attributed to more than inflation.
Category Guide Intro: The Value Equation
For instance, the in-store deli posted strong sales and volume in the most recent 52 week period. The department saw a 7.2% increase in overall sales, according to the Nielsen Perishables Group. Consumers’ turning to supermarket prepared foods in place of restaurants or home cooking has helped bolster this growth.
For the second year, the Fresh Market section of SN’s annual category guide features data from the Nielsen Perishables Group, Chicago, for in-store deli, vegetables, fruits, beef, in-store bakery, poultry, seafood and pork. Chicago-based SymphonyIRI continues to provide data for the dairy aisle categories: milk, natural cheese, yogurt, refrigerated juices, luncheon meats, breakfast meats and eggs.
FRESH MARKET KEY CATEGORIES
Supermarket dollar sales and percent change from last year
DAIRY AISLE
Milk | $11.0B | 3.0
Natural Cheese | $8.0B | 6.5
Yogurt | $4.5B | 7.5
RFG Juice/Drinks | $4.2B | -0.2
Luncheon Meats | $3.5B | 0.3
Breakfast Meats | $3.5B | 4.2
RFG Fresh Eggs | $3.4B | 6.6
PERISHABLES*
In-Store Deli | $15.6B | 7.2
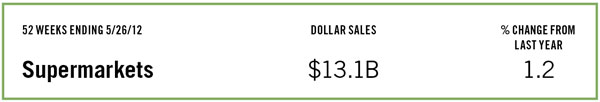
Vegetables | $13.1B | 1.2
Fruits | $13.1B | 4.9
Beef | $11.4B | 3.9
In-Store Bakery | $7.0B | 4.3
Poultry | $6.7B | 4.2
Seafood | $4.3B | 4.7
Pork | $3.1B | 3.7
*Data compiled from a changing store set each year; percent change is not based on sale figures published in the 2011 SN Category Issue.
Milk, Natural Cheese, Yogurt
Milk
Dollar sales of fluid milk are up across the board — in all U.S. retail venues — but unit sales continue to decline, according to the SymphonyIRI Group.
Unit volume for the 52 weeks ending June 10 is down more than 5%, possibly precisely because dollar sales are up.
 “Beverage milk sales at retail are a sorry sight, down, down, down,” Jerry Dryer, Florida-based dairy market analyst, told SN.
“Retailers need to do some serious promotion. People who buy milk have families at home and spend a lot more money in the store than non-milk buyers.”
Competing products hitting the dairy case also could be a factor.
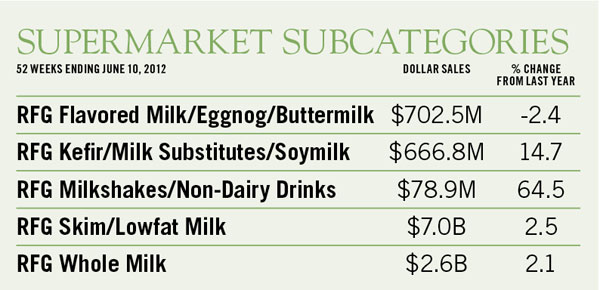
Dollar sales of kefir and milk substitutes, for example, are up more than 14.7%, and dollar sales of milkshakes and non-dairy drinks are up by a whopping 60-plus%.
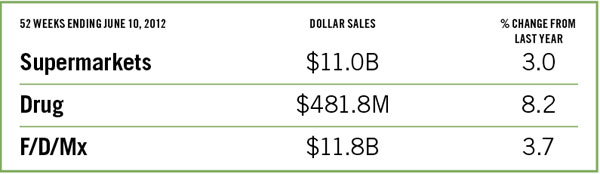
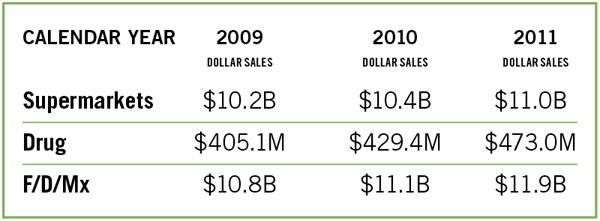
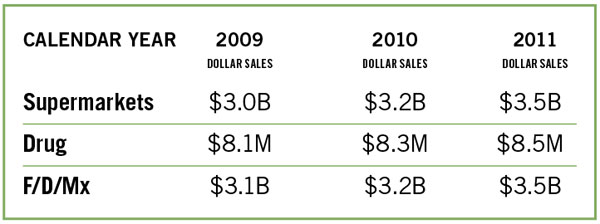
For the 52 weeks ending June 10, dollar sales of milk in supermarkets were up 3% from a year ago, in F/D/Mx, 3.7%. Drug stores — though from a small base — chalked up an 8.2% rise over last year.
Some supermarkets in the past used milk as a loss leader, but volatility in pricing has stopped that. Some industry sources, however, urge promotional activity for the benefit of the whole store.
Meanwhile, at least one retailer — Chandler, Ariz.-based Bashas’ — has just launched a promo spotlighting its gallon-size milk. When a shopper has bought five gallons of any type or brand of milk with a loyalty card, the shopper gets a coupon for a free gallon of any type of Bashas’ milk.
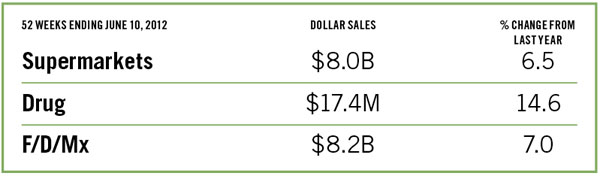
Natural Cheese
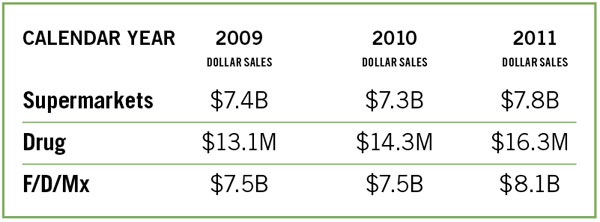
This category saw dollar sales up in all retail venues, with supermarket sales showing a 6.5% rise over a year ago, according to SymphonyIRI Group’s data for the 52-week period ending June 10.
Drug stores experienced the biggest jump in sales, a double-digit increase for the second year in a row. Although at $17.4 million, drug stores’ total sales for cheese is relatively small, it’s up 14.6% from a year ago.
 Those figures, like some in other food categories, emphasize that consumers are increasingly taking advantage of the convenience offered by fresh food at their local drug store.
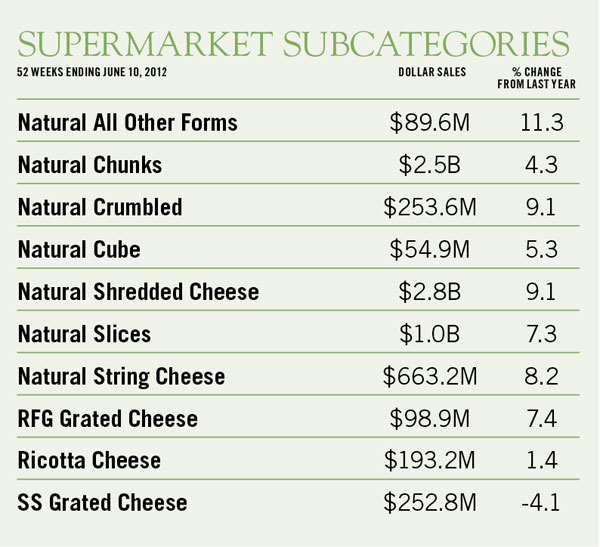
Convenience and snack items had dollar sales hikes in all U.S. food outlets. Natural crumbled cheese and shredded cheese were up 9.1% from a year ago, and string cheese, 8.2%.
With cheese production strong until early June, the category’s inventory has grown, and wholesale prices have dipped as low as $1.50 a pound, compared to last year’s high of $2, Bob Cropp, dairy market specialist at the University of Wisconsin, Madison, told SN. Now, with drought conditions in the Midwest impacting milk production, the wholesale price is climbing, but Cropp predicts natural cheese sales at retail will stay steady with probably no volume decline in the coming year.
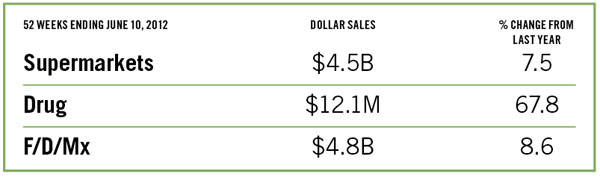
Yogurt
Yogurt sales in the U.S. are booming. Indeed, the category is being eyed by several companies as one of the best growth categories in the country.
For the 52 weeks ending June 10, 2012, dollar sales of yogurt in U.S. supermarkets hit $4.5 billion, a hike of 7.5% from a year earlier, according to data from SymphonyIRI Group.
 Even more impressive, albeit from a small base, are dollar sales in the drug store channel, SymphonyIRI reports. With $12.1 million in sales, drug stores saw dollar sales for the 52-week period zoom up 67.8% from a year ago.
Apparently recession-proof, the category has grown each year since 2006, which makes the category attractive to newcomers, who see it growing to a $9 billion category in 2016, even though unit volume was down 4.3% this year.
The recent growth of the Greek segment of the category has reshaped the entire yogurt category with Greek representing one-third of the total value. This has slowed volume growth since Greek is about twice expensive on a per-ounce basis, a Dannon Co. spokesman told SN.
Just last month, the manufacturer PepsiCo announced it would enter the U.S. market with yogurt.
“There are strong growth prospects. U.S. yogurt consumption is only half of that in Europe,” a PepsiCo official said in a statement.
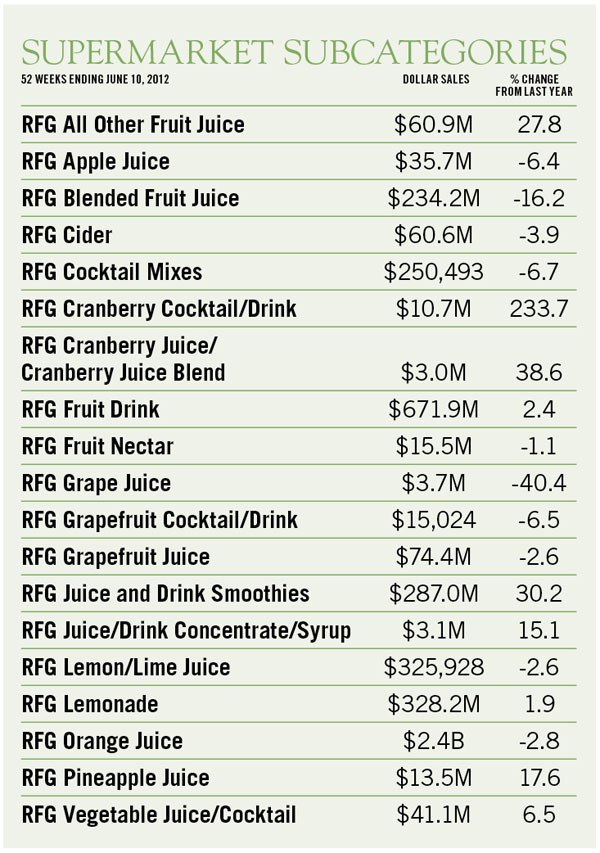
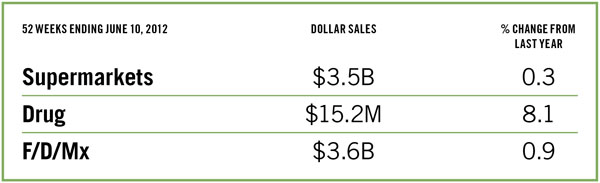
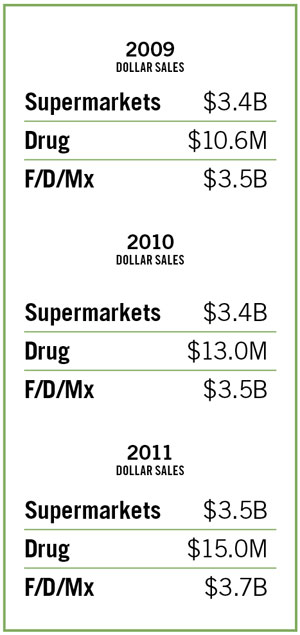
Rfg Juice/Drinks, Luncheon Meats, Breakfast Meats
Refrigerated Juice/Drinks
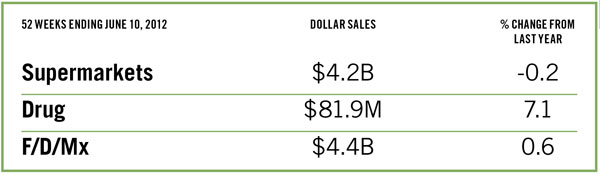
Refrigerated juices in the dairy case have taken a hit. Supermarket dollar sales for the 52-week period ending June 10, 2012, were down 0.2% from a year earlier, and unit sales in all U.S. food venues dipped by 3.9%, according to data from the SymphonyIRI Group.
 One industry source suggested other beverages in the dairy case, including kefir, may be taking away sales because they are perceived as healthier.
With super-sized sodas facing a ban in New York City, and media attention given to sodas’ sugar content, sugar-consciousness could be carrying over to refrigerated juices. Dollar sales of orange juice — once considered a staple — are down 2.8% for the same 52-week period, continuing a downward trend.
Retail prices could also factor into the decline as more premium versions of OJ are marketed with bigger price tags. The growing list of refrigerated juice subcategories, too, may be cannibalizing orange juice sales and creating more competition.
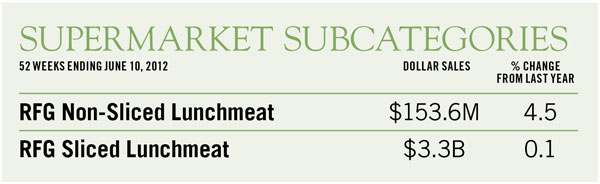
Luncheon Meat
Unit sales of luncheon meats are down, even while dollar sales are up in all retail venues. For the 52 weeks ending June 10, 2012, unit volume was down by 3.5% from a year ago, but dollar sales hit $3.5 billion in supermarkets for the calendar year 2011, giving the category a 0.3% gain in June from a year earlier, according to data from the SymphonyIRI Group.
Dollar sales of sliced luncheon meat for the 52 weeks ending June 10 were up in all food venues, but only by 0.1%.
By contrast, dollar sales of nonsliced luncheon meat, which includes hot dogs and cooked sausages, were up 4.5% from a year earlier. That subcategory had an 8.1% increase at drug stores, which carry limited SKUs in the category, mostly hot dogs.
“I suspect this represents greater occasions of grilling. It’s a substitute protein that tastes good and is easy,” said Bill Bishop, chairman, Willard Bishop LLC, a retail consulting firm. “We’ve seen this before in economic downturns.”
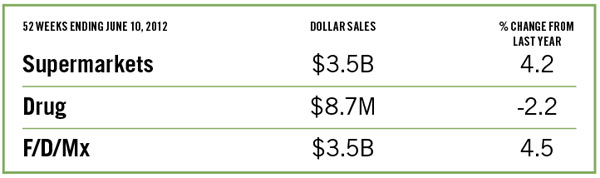
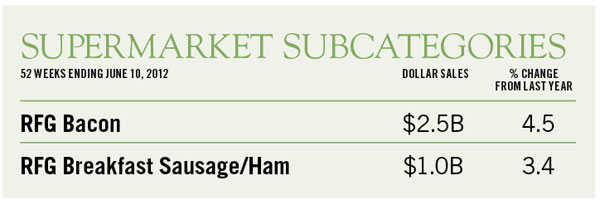
Breakfast Meat
Although consumer research often finds that people are eating breakfast on the run, or not at all, breakfast meat sales are holding up. For the 52-week period ending June 10, 2012, supermarket dollar sales in this category had risen 4.2% from a year ago, according to data from SymphonyIRI Group.
“There’s been investment in innovation and marketing of bacon in the last two years,” Bill Bishop, chairman, Barrington, Ill.-based Willard Bishop LLC, told SN.
For calendar 2011, supermarkets posted $3.5 billion sales for the category against $3.2 billion in calendar 2010. What’s more, bacon dollar sales were up 4.5% in total food venues for the 52 weeks ending June 10.
“We’ve done a lot of work on breakfast. People may not be eating breakfast every day, but more are eating breakfast at home on Sunday. It can be a hearty, warm, comforting kind of meal,” Bishop said.
There has been some activity in other breakfast-related categories and by some retailers to promote breakfast at home.
Fresh Eggs, In-Store Deli, Vegetables
Fresh Eggs
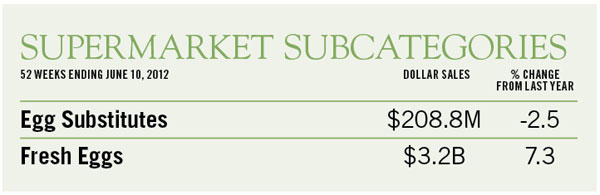
Eggs are definitely back in consumers’ good graces. For years, consumers were wary of eggs’ cholesterol content, but studies proved it was not harmful.
The sales comeback was gradual, but for the 52-week period ending June 10, 2012, supermarket dollar sales of eggs rose 6.6% from a year ago and drug store dollar sales jumped an impressive 22.7%, according to SymphonyIRI Group’s data.
 Most impressive in this year’s SymphonyIRI’s figures is the hike in dollar sales of eggs at drug stores.
That dramatic increase could be occasioned by a number of things: new distribution channels, drug stores adding more refrigerated space to offer eggs, or the sheer convenience of picking up a dozen eggs at the corner drug store.
Growing confidence in the nutritional value of eggs may have contributed to slumping sales numbers for egg substitutes, which lost 5.2% in volume and 2.5% in sales dollars in total food channels.


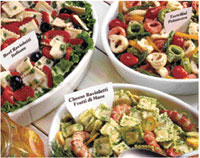
In-Store Deli
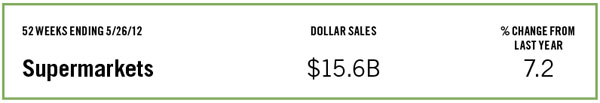
The deli has had good growth over the past year. Stores have had a 7.2% boost in sales bringing in $15.6 billion in dollar sales over the last 52 weeks ending on May 26, according to data from the Nielsen Perishables Group.
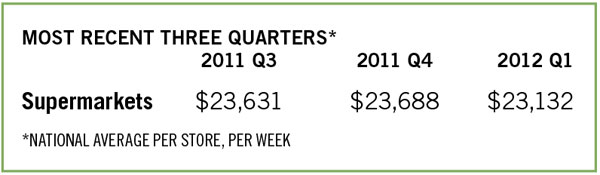
Price increases in the deli haven’t seemed to deter shoppers from buying more product than last year. Average volume sales have gone up by 3.4% per store, per week vs. last year.
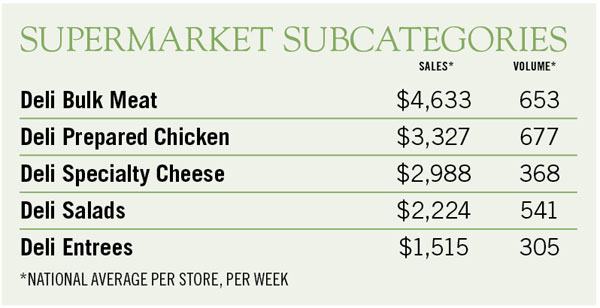
 The convenience offerings in the deli have driven the category’s growth. Prepared chicken leads in volume sales and growth, a 5.3% increase on average per store, per week. Prepared entrees have fared well, too, with a 9.7% growth in dollar sales and a 4.9% growth in volume.
Consumers are eating more meals at home, but have different definitions of eating at home, such as cooking from scratch, or putting together meals with little preparation or grab-and-go options, said Paisley Peterson, senior account manager, Nielsen Perishables Group.
Those looking for grab-and-go or meals with little preparation “are driving deli prepared foods’ success,” Peterson said. “Retailers are also responding positively by offering greater selections of deli prepared foods, which is in turn fostering the growth further.”
The deli bulk meat category still brings in the most deli dollars, an average of $4,633 and 653 units per store, per week, but like many other protein categories this year, it has experienced a decrease in volume — 2.9% on average.
Nielsen Perishables Group FreshFacts data represents approximately 63% of national supermarket ACV share.
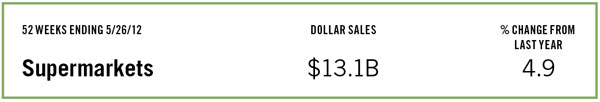
Vegetables
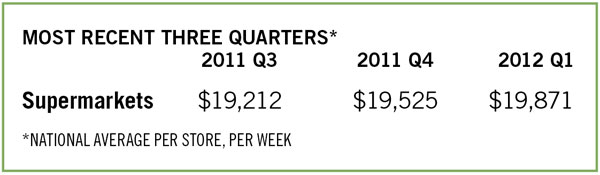
Vegetable sales have stayed stable for the 52 weeks ending May 26 with $13.1 billion in overall sales, a 1.2% increase from last year, according to data from the Nielsen Perishables Group.
The average sales per store, per week had a 0.4% increase with unit sales down 1.2%.
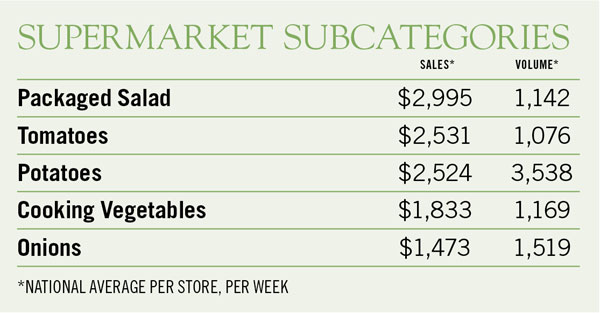
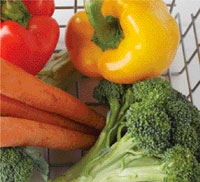 As consumers grow increasingly health conscious, they are still looking for convenience and show a willingness to pay for it. Packaged salad continued to grow in popularity, bringing in the most vegetable dollars, $2,995 per store, per week. Packaged salad also experienced a slight volume increase of 0.6%.
Both tomatoes and onions saw a slump in sales this year, yet didn’t experience a significant drop in volume sales. The drop in sales dollars could likely be attributed to retailers offering discounted prices for these staple items.
Potatoes saw a 4.9% increase in dollars per store, per week, but lost a similar amount in volume, 4.5%.
Nielsen Perishables Group FreshFacts data represents approximately 63% of national supermarket ACV share.
Fruits, Beef, In-Store Bakery
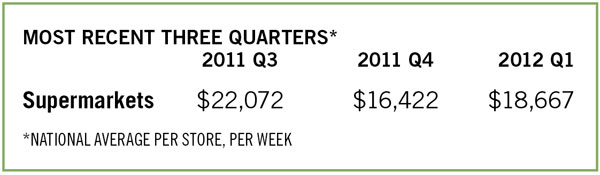
Fruits
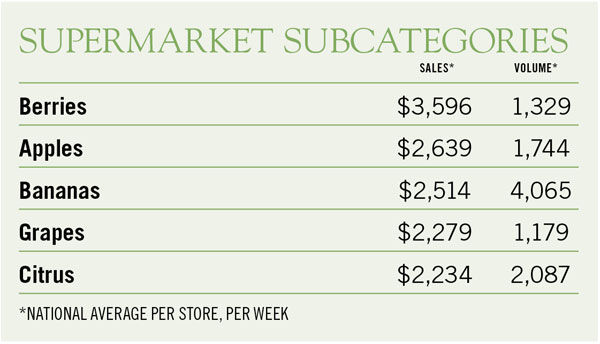
Berries continue to lead the fruit category. Over the 52 weeks ending May 26, berries gained 10.7% in volume sales and 12.2% in dollar sales on average per store, per week, according to data from the Nielsen Perishables Group.
The berry consumer is also a consumer likely to purchase indulgent items in other departments, noted the Nielsen Perishables Group in its June newsletter. Consumers who buy berries are three times as likely to purchase it with lobster, the group said.
 Overall, fruit has had a slight, 1% decline in average volume per store, per week. This volume, though, was paired with a 4.1% increase in weekly sales. Weekly supermarket fruit sales averaged $19,785 per store.
Apple volume sales haven’t been affected greatly by price increases. The category only had a .2% reduction in unit sales, with a 4.9% boost in dollar sales.
Citrus, on the other hand, saw a drop in dollar sales and volume, 0.6% and 1.7%, respectively.
Nielsen Perishables Group FreshFacts data represents approximately 63% of national supermarket ACV share.
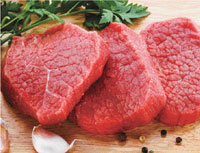
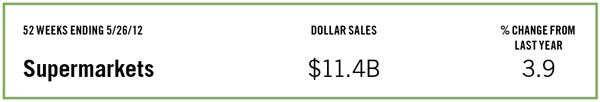
Beef
Supermarket beef dollar sales grew 3.9% to nearly $11.4 billion, in the 52 weeks ending May 26, according to data from the Nielsen Perishables Group.
Production costs and limited availability have led to climbing retail beef prices.
 The U.S. has had historically tight supplies of meat, said Glynn Tonsor, assistant professor of agricultural economics, Kansas State University, in a recent interview with SN.
Consumers have responded to the higher prices by purchasing less meat. This year beef had a 6.9% decrease in volume sales per store, per week.
With an ongoing drought in the Midwest driving up the cost and availability of feed, this trend is likely to continue into next year.
“There’s lots of discussion within the beef industry … if and when we’re going to have expansion of the herd with more cows and this certainly is delaying that story. It’s hard to expand the herd when two-thirds of the country is under drought,” Tonsor said.
Nielsen Perishables Group FreshFacts data represents approximately 63% of national supermarket ACV share.
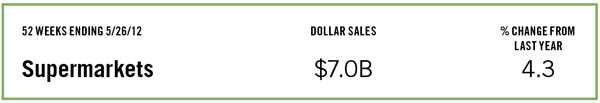
In-Store Bakery
Customers may be health conscious, but they are still indulging in the bakery.
The in-store bakery had nearly $7 billion in overall sales for the 52 weeks ending May 26, growing 4.3% this year, according to data from the Nielsen Perishables Group.
 The average volume per store, per week, decreased by 0.7%, but dollars per store increased by 3.5% on average.
Large sweet treats were popular. Cakes saw a 4% increase in sales, bringing sales to $3,069 dollars per store, per week, and a 1.7% volume increase.**
Handheld sweet snacks also did well. Cookies brought in $1,056 per store, per week, 5.6% more than last year, with a volume increase of 1.6%. Doughnuts had $783 in sales per store, with a 4.2% increase in dollars and a 1.6% increase in volume.
Savory bakery items haven’t fared as well as sweets over the past year. Bread kept sales steady while volume sales took a hit: down 4.7% in units with only a 1.4% sales increase.
Nielsen Perishables Group FreshFacts data represents approximately 63% of national supermarket ACV share.
**An earlier version of this article cited incorrect sales numbers for cake, rolls, cookies and donuts. The Nielsen Perishables Group issued a correction after publication.
Poultry, Seafood, Pork
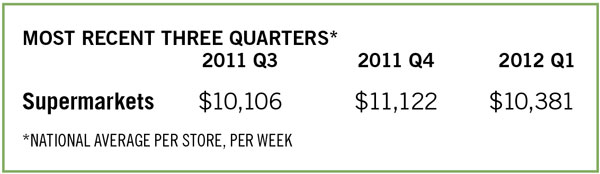
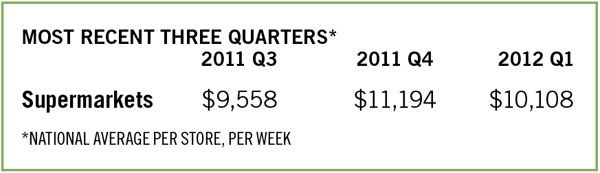
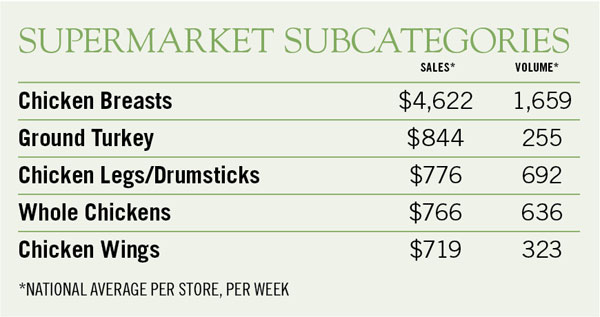
Poultry
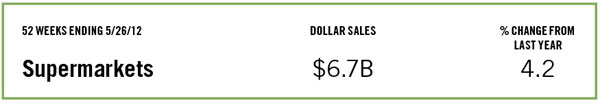
Overall poultry sales were almost $6.7 billion in the 52 weeks ending May 26, according to data from the Nielsen Perishables Group.
The protein has seen a 4.2% increase in sales from last year. Dollar sales per store, per week averaged $10,209, with a slight volume decrease of 0.6%.
 Although poultry has seen inflation due to higher production costs, the category continues to be one of the lower-priced proteins that appeal to cost-conscious consumers.
Due to widely fluctuating feed prices, starting last fall, chicken suppliers have been negotiating shorter contracts with price protections. These new contracts likely also contributed to the rising prices at retail.
Chicken breasts brought in more sales than ground turkey, chicken legs/drumsticks, whole chickens and chicken wings combined. Chicken breasts alone had $4,622 in sales per store, per week, with volume sales up 1.3%.
Whole chickens saw a 1.4% decrease in dollars and a 5.1% decrease in volume.
Chicken wings had healthy sales, up 2.4%.
Rising prices for turkey helped give retailers 7.8% in sales gains vs. last year. The sales gains came with a 3.3% loss in volume.
Nielsen Perishables Group FreshFacts data represents approximately 63% of national supermarket ACV share.
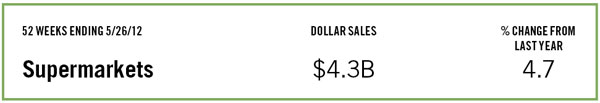
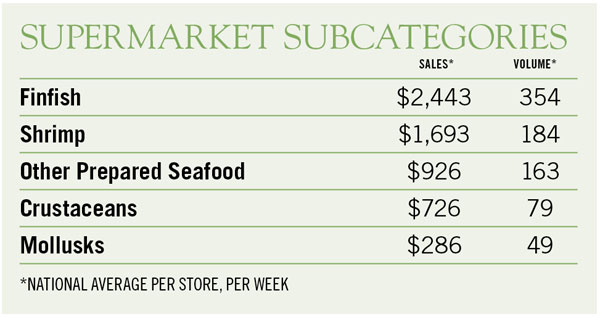
Seafood
Seafood sales are back in black. Seafood departments brought in $4.3 billion in overall sales in the 52 weeks ending on May 26, a 4.7% increase from last year, according to data from the Nielsen Perishables Group.
Higher prices likely contributed to a 7.5% increase in fin fish dollar sales per store, per week, but the category was still able to increase volume sales by 1.9%.
 Shrimp, mollusks and crustaceans all saw significant volume decreases. Shrimp sales per store, per week were up 1.7%, but unit sales decreased 8%. Crustaceans were down 1.2% in dollars vs. last year, with a 9% drop in volume. Similarly, mollusks had a 2.9% decrease in sales and 7.1% decline in volume.
Consumers’ cost consciousness over the past several years has made selling seafood a challenge since the category can be more expensive than other proteins. Retailers have responded by promoting the health benefits of seafood to show value.
To combat the fact many shoppers aren’t comfortable preparing their own seafood, retailers have also been demoing recipes and offering meal preparation information to help customers cook seafood at home.
Nielsen Perishables Group FreshFacts data represents approximately 63% of national supermarket ACV share.
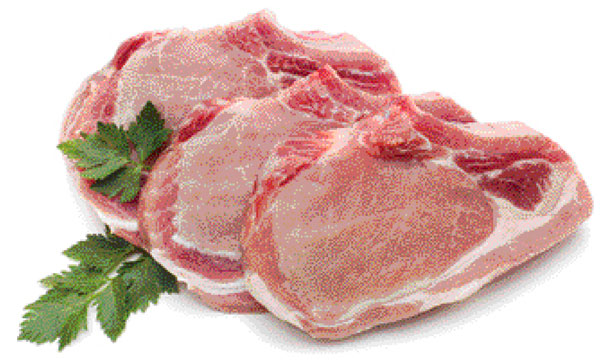
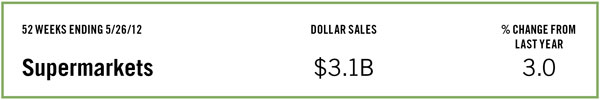
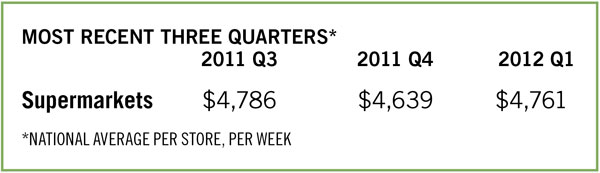
Pork
Pork sales were $3.1 billion for the 52 weeks ending May 26, growing 3.7%, according to data from the Nielsen Perishables Group.
Pork — as well as the other protein categories — has seen higher prices at retail because of higher production costs, international demand and limited supplies. The high sticker prices have contributed to a 4% decrease in volume sales per store, per week.
 The growing prices continue from last year and are likely a long-term trend. The drought in the Corn Belt this summer has devastated corn feed supply forecasts and is predicted to drive up feed prices.
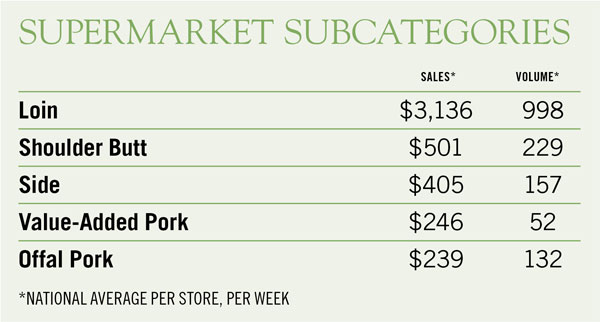
All of the main pork categories have had volume losses paired with gains in dollar sales. Loin brought in $3,136 in average sales per store, per week, a 1.5% dollar sales boost with a 4.3% decline in volume. Shoulder butts had a 6.4% sales increase and 6% loss in volume.
The National Pork Board has launched a series of promotions to advance pork sales at retail. The most recent promotion aims to help consumers prepare pork at home by highlighting versaility and offering recipes for different pulled pork dishes.
Nielsen Perishables Group FreshFacts data represents approximately 63% of national supermarket ACV share.
| Suggested Categories | More from Supermarketnews |
 |
|
|
|
|

|
|


