
Retailers and their supplier trading partners have been making an ever-increasing effort to collaborate across a wide array of promotional and supply chain initiatives over the past few years, as evidenced by the growing number of trade conferences co-sponsored by the Food Marketing Institute and the Grocery Manufacturers Association.

Further evidence of that collaboration now comes from SN’s latest survey of the technology used by food retailers as 28.9% of respondents said they are sharing data with their suppliers. Moreover, the survey reveals that 40% of larger retailers (with 50 or more stores) are sharing data, while 23.3% of smaller retailers (fewer than 50 stores) are doing so.
This is not the only example in the survey of greater adoption of an application by larger retailers — indeed, with numerous systems, larger retailers are seen to have a leg up on their smaller counterparts, indicating a significant “technological divide” in the food retailing industry.
SN’s online survey, conducted by Penton Research, a sister division of SN, from Feb. 2 through Feb. 21, forms the basis of this 17th annual State of the Industry Report on Supermarket Technology. Eliciting 45 responses from food retail and retail/wholesale companies, the survey asked about a broad spectrum of technology applications that retailers are currently using as well as those they plan to test or launch this year. It also delved into their IT budgets, digital marketing efforts, compliance with the PCI data-security standards, ability to scan the GS1 DataBar, among other IT issues.
This year’s survey drew more responses from smaller retailers. Of the 45 respondents, 30 (two-thirds) represented companies with fewer than 50 stores, and 13 (28.9%) were one-store operators. However, of the 15 respondents from companies with 50 or more stores, 14 reported sales of $1 billion or more; this, plus one smaller company, represents 21% of the 71 companies with stores and more than $1 billion in sales in SN’s list of the Top 75 North American food retailers.
Impact of Economy

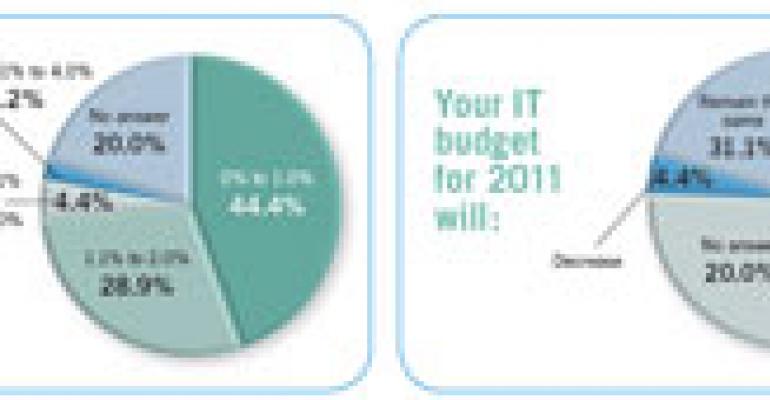
The economic downturn of the past few years has impacted not only what individual IT investments retailers have made but their overall spending on technology. In fact, SN’s survey indicates that many retailers are still somewhat conservative with their IT spending, with 42.2% spending the same amount now as they did at the peak of the recession, and less than one-fourth (24.4%) spending more.
Still, 42.2% of respondents said they would increase their IT budgets in 2011 from 1% to 10%.
Among 45 applications/technologies listed in the survey, the most commonly used application cited by respondents is cashier monitoring, which analyzes POS data to pick up signs of illegal or unproductive cashier behavior — perhaps a sign of the difficult economy. More than half (55.6%) of respondents chose cashier monitoring as an application they currently employ.
In addition to cashier monitoring, other traditional applications most commonly used by survey respondents were category management (44.4%), scale management (37.8%), DSD systems (33.3%) and card-based loyalty systems (31.1%). The percentages were higher for the larger retailers — 53.3% for category management and card-based loyalty, and 46.7% for scale management and DSD systems.
Two digital applications — social media and online coupons — found themselves near the top of the list of applications used by respondents, with 44.4% employing social media and 37.8% featuring online coupons on their websites; two-thirds (66.7%) of the larger respondents are offering online coupons.

One of the more notable findings in the survey is that computer-based ordering (CBO) is used by 26.7% of respondents. Widely adopted in Europe, CBO has been largely avoided in the U.S. for decades. U.S. retailers have traditionally relied on handheld-terminal-wielding store employees roaming store aisles to generate product replenishment orders for warehouse-supplied items. With CBO, which sometimes goes by computer-assisted ordering or computer-generated ordering, the computer makes ordering decisions, subject to tweaking by store employees.
Because CBO is an application that requires an investment in demand-forecasting software and a commitment to establishing a perpetual inventory count in stores, many retailers, especially smaller operators, have found it too daunting, especially in demanding economic times.
Last year, however, 27.8% of respondents to SN’s survey said CBO would be a high-priority application and this year’s survey shows that many retailers have adopted the process. Apparently, reports of successful CBO implementations by such operators as Price Chopper and Hannaford Bros. have stoked interest among U.S. food retailers.
Price Chopper Supermarkets, Schenectady, N.Y., has reported reducing out-of-stock levels for warehouse-delivered Center Store and nonfood products to 2%, from as much as 4.5% by using CBO. Moreover, the chain has taken the unusual step of applying CBO to perishables and direct-store-delivery items. Following the implementation of computer-assisted ordering in its stores, Hannaford Bros., Scarborough, Maine, improved its sales in 2007 by more than one percentage point through the reduction of out-of-stocks. At the same time, the chain freed up $3.5 million of capital through lower inventory levels in its stores.
Tracking Perishables
An application related to CBO that is used by just under one-quarter of respondents (24.4%) is fresh-item management (FIM), though the divide between large and small retailers (40% vs. 16.7%) remains wide.

Like CBO, FIM uses automation to order fresh products, but FIM also tracks shrink and plans production of perishable products. Last year Clinton Keay, senior vice president and chief information officer for Sobeys, Stellarton, Nova Scotia, described the chain’s adoption of a FIM system. Keay said the FIM system has enabled Sobeys to achieve a better in-stock position, improve sales and margins, and reduce shrink in its perishables departments.
“We are seeing an increase in inquiries in this area from food retailers,” Mike Griswold, vice president, research, AMR Research, Boston, said last year. “I think the realization that FIM can provide significant shrink and margin improvements is finally sinking in.”
Direct–store delivery has for many years been augmented by technology such as DEX (direct exchange), NEX (network exchange) and, more recently, ASNs (advanced shipping notices). In the SN survey, 33.3% of all respondents are using one of these DSD systems, including 46.7% of larger retailers and 26.7% of smaller retailers.
DSD system adoption appears to have grown since 2005. That year, GMA reported that only 35% of large-format food retailers used some form of an electronic receiving program. Of those, 54% used DEX, whereby the DSD delivery representative connects a handheld device into a docking station at the retailer’s back room to transmit invoice information. Another 6% used NEX, similar to DEX except that the information is sent from a supplier’s headquarters to a retailer’s headquarters and then to stores.

While more retailers are adopting DSD systems, some retailers are dissatisfied with the level of adoption of those systems by DSD suppliers. Susan Moore, director of electronic data for Safeway, Pleasanton, Calif., said last year that she would like to see a serious upgrade in the technology used by some suppliers for the check-in of direct-store-delivery goods at Safeway stores. “If we’ve recognized what technology can do for the front of the store, why is it we still have a pencil and clipboard at the back door?” she said.
Scan-based trading (SBT), whereby retailers pay vendors for goods after they are scanned at the POS, is another ordering system cited by a number of respondents, 22.2% overall, including 53.3% of larger retailers but only 6.7% of smaller operators. SBT has been implemented by such retailers as Safeway, D’Agostino’s Supermarkets, Lund Food Holdings, and Strack and Van Til.
SBT involves sharing POS data with suppliers, which 28.9% of respondents said they are doing as a separate application, including 40% of larger retailers. This is perhaps not so surprising for the larger retailers. In 2009, the Grocery Manufacturers Association published a white paper stating that most U.S. grocery retailers and mass merchandisers with more than $5 billion in annual sales are sharing weekly and even daily store sales and other data directly with their suppliers at no cost. But for 23.3% of smaller retailer respondents to be sharing data with suppliers suggests that the trend is gaining some traction across the industry.
The GMA report identified more than 30 business benefits that can result from exchanging retailer data. Among these benefits, which generally accrue to both retailers and manufacturers, are reduced out-of-stocks and inventory, improved forecast accuracy, lower merchandising costs and increased sales.
Another form of data sharing is synchronization of product data between retailers and manufacturers. One of the biggest industry technology initiatives since 2004 has been data synchronization through the Global Data Synchronization Network (GDSN), which is managed by GS1, Brussels. GDSN has expanded substantially since its inception, but much more among manufacturers than retailers, which is reflected in the SN survey.

Last June, among the 23,574 companies that registered global location numbers (GLNs) in GDSN, just 360 were retailers of any kind. Although major food retailers like Supervalu, Wal-Mart, Wegmans and others leverage the GDSN, there is evidence that a number of food retailers have yet to do so. In the SN survey, just 20.0% of respondents said they use data synchronization — 26.7% of larger retailers and 16.7% of smaller retailers.
In other in-store technology, price optimization has been one of the more frequently adopted applications in recent years, by both small and large retailers. In SN’s survey, about one in four (24.4%) of respondents said they use price optimization.
A trio of price optimization vendors — KSS Retail, Revionics and DemandTec — has been making headway with grocers, even during the recession, with systems that have become more affordable. In many cases, the software is being sold on a software-as-a-service (SaaS) basis.
Over the past several years, some retailers — notably Wal-Mart Stores — have used electronic check conversion at the POS via readers that capture MICR (magnetic ink character recognition) information from a check and transmit it to the Automated Clearing House (ACH) network. Paper checks are returned to the customer at the POS, and the customer must sign a receipt. In 2007, this process was extended to the back office of stores.
Either way, check conversion offers faster clearing, lower return fees and inexpensive ACH transactions (less than 5 cents per transaction). SN’s survey shows some adoption of check conversion at the POS, with 22.2% of respondents using it (33.3% of larger retailers and 16.7% of smaller retailers), but minimal adoption (11.1%) in the back office.
POS systems typically receive considerable attention from retailers. In the survey, 28.9% of respondents said that none of their POS systems would be upgraded or replaced in 2011. But others selected from a list of equipment that would be upgraded or replaced, including software (28.9), scanners (26.7%), terminals (26.7%), payment devices (17.8%) and printers (15.6%).
Popular Digital Apps
Digital applications have come of age in food retailing as hordes of retailers are connecting with shoppers through social media, online coupons and mobile applications, along with much more robust websites. In the survey, social media such as blogs, Facebook and Twitter was tied for the second-most popular application, with 44.4% of respondents using it.
In addition to posting everything from promotions to recipes to employee birthdays on their Facebook and Twitter feeds, retailers are leveraging social media to gain the kind of feedback that the Internet in general is unable to offer. When Supervalu has looked across the Internet — outside of social media — for comments about its retail brands, the company tends to just find talk about price and discounts. “There wasn’t a lot of feedback about whether our brand was doing well or not,” said Shelly Nelson, director of connections strategy and media for Supervalu, during a social media panel discussion at the LEAD Marketing Conference last fall. “But we definitely see that on Facebook.”
Online coupons also scored well in the SN survey, with 37.8% of respondents using them, including 66.7% of the larger retailers and 23.3% of the smaller retailers. More than one-fourth (26.7%) of the smaller retailers said they would test or launch online coupons in 2011. Some retailers offering online coupons, such as Skogen’s Festival Foods, Green Bay, Wis., allow shoppers to print them out at home, while other card-based retailers enable shoppers to download coupons to their loyalty card for electronic redemption at the POS.
Mobile marketing may be the hottest trend in retailing overall, and is increasingly infiltrating food retailing. Only 6.7 of the smaller retailers in the survey use it now, along with 26.7% of the larger retailers, but more than one-fourth (26.7%) of smaller retailers said they would test or launch mobile marketing this year.
Mobile coupon redemption remains a work-in-progress for food retailers. Cashiers need to be equipped with image scanners to scan bar codes directly off a mobile phone; since many stores lack that type of scanner, more time-consuming alternatives are being used.
Food retailers are also using their websites to build brand equity and earn the loyalty of shoppers, particularly through meal planning and list-building features. Meal planning/recipes apply to 46.7% of respondents in the survey, with weekly fliers at 44.4%.
Matter of Compliance
Survey respondents were also asked a series of questions about compliance with industry standards and initiatives. In these areas, smaller retailers sometimes surpassed their larger counterparts.
For example, a large percentage (84.4%) of respondents said they were in compliance with the PCI (payment card industry) data security standard, which is imposed by the card industry on retailers that accept credit and debit cards. That included 93.3% of smaller retailers and 66.7% of larger retailers. While PCI compliance is no guarantee of protection against hackers — as Hannaford Bros. learned in 2008 — retailers have made sure to follow the standard at least to avoid fines for noncompliance.
The Rapid Recall Exchange, a Web-based system created by the Food Marketing Institute and GS1 US, has improved the communication of recall information from manufacturers to retailers; it now includes more than 500 retailer, wholesaler and manufacturer subscribers. In the survey, without naming the Exchange, 64.4% of respondents said they can receive recall information electronically from suppliers, including 70% of smaller retailers and 53.3% of larger retailers.
In another area of food safety, produce trade associations have developed the Produce Traceability Initiative to help suppliers, distributors and retailers trace the source of contaminated food. In the survey, 33.3% of respondents, including 40% of larger retailers and 30% of smaller retailers, said they planned to meet the traceability requirements of the Initiative, which includes the ability to scan produce cases and store the data; another 33.3% of all respondents said it was under consideration.
One of the more pressing technology issues facing retailers this year is the emergence of the GS1 DataBar as the only bar code that will appear on coupons beginning July 1. In January, manufacturers were given the go-ahead to start removing the UPC-A bar code, which has been sharing space with the DataBar over the past two years. The DataBar is designed to encapsulate a great deal more information than the UPC-A code.
If retailers’ POS systems aren’t already prepared to scan and process coupons bearing only the DataBar, they will need to get ready soon or face the prospect of manually redeeming coupons at the checkout. In the SN survey, 62.2% of respondents said they are ready. Of those who said they are not ready, 27.3% said they would be by July 1, the effective deadline.
Coupons are not the only vehicle for the DataBar. A different form of the DataBar is also increasingly present on stickers — which also contain a price look-up number (PLU) — attached to loose produce. But no sunrise date has yet been established for leaving only the DataBar without the PLU on these stickers. Scanning the DataBar on loose produce eliminates the need for cashiers (or shoppers at the self-checkout) to key-enter the PLU number. The accuracy gained helps to reduce the shrink that occurs when organic or exotic produce is not identified correctly.
In the survey, 55.6% of respondents said their company can scan and process the GS1 DataBar for produce, including 56.7% of smaller retailers and 53.3% of larger retailers. Of those unable to do so, 26.7% said they would sometime in 2011.
About the Survey
SN’s 17th annual State of the Industry Report on Supermarket Technology is based on a survey of 45 food retailing companies, including 42 retailers and three wholesale companies with corporate retail stores. The survey was developed by SN editors and conducted by Penton Research, a sister division of SN, from Feb. 2 through Feb. 21.
Of the 45 respondents, 30 (two-thirds) represented companies with fewer than 50 stores, and 15 (one-third) were from companies with 50 or more stores. More than one-third of respondents (37.8%) said their company operates between two and 49 stores, and 28.9% of respondents said they were one-store operators.
One-third (33.4%) of respondents reported that their company’s annual sales were $1 billion or more, including 15.6% with sales of $20 billion or more. In addition, 55.7% of respondents said their company had sales of under $1 billion, with 33.3% reporting sales under $50 million. No sales volume was reported by 8.9% of respondents.
The job titles of respondents included director (20%), president (17.8%), senior vice president or chief information officer (13.3%), chief executive officer (11.1%) and vice president (6.7%).