Study: SNAP customers weigh heavily in grocery purchasesStudy: SNAP customers weigh heavily in grocery purchases
Beneficiaries account for 24% of U.S. CPG spend and generate an $18 higher grocery spend per trip, Numerator reveals.

With pandemic-extended benefits under the Supplemental Nutrition Assistance Program (SNAP) ended nationwide as of March 1, a new Numerator study re-emphasized SNAP participants’ impact on the grocery retail marketplace.
Overall, SNAP recipients represent 24% of total U.S. spending on consumer packaged goods, consumer data specialist Numerator said in its “Helping SNAP Consumers During Economic Headwinds” report, released Wednesday.
Bigger basket sizes have fueled that CPG market share, Numerator’s research showed. When SNAP participants use their benefits during a shopping trip, the ticket size is $15 more and grocery spend per trip is nearly $18 more. Units per trip, too, double from 5.2 to 10.4.
What’s more, SNAP users spend disproportionately more per unit on CPGs. Numerator found that, for the quarter ended Dec. 31, SNAP customers paid 13% more per unit year over year, compared with 11% more for non-SNAP consumers. That was driven by higher inflation on baby care and health-and-beauty aids as well as in the dollar store retail channel, areas in which SNAP consumers overindex, the report said.

Source: Numerator “Helping SNAP Consumers During Economic Headwinds” report, March 2023.
Numerator’s SNAP study sources data from its Insights research base (for the 12 months ended Dec. 31, 2022) and a Feb. 9-10 sentiment survey of 1,250 SNAP beneficiaries. The study measured SNAP customers who made 12 or more shopping trips and used their benefits for purchases over the past 12 months.
Nearly 42.6 million Americans participate in SNAP, formerly known as food stamps, up 1.1% month to the month and 3.1% year over year, according to the latest data from the U.S. Department of Agriculture’s Food and Nutrition Service (FNS), which administers the program. That includes just under 22.5 million households, up 1.4% on a monthly basis and 4.1% annually as of December 2022. Among states, California led with 5.2 million SNAP recipients, followed by Texas (3.7 million), Florida (3.1 million), New York (2.9 million) and Illinois (2.1 million).
Nationwide, monthly benefits as of December totaled almost $11.05 billion, up 1% month to month and 12.1% year over year, FNS data show. California tallied the most SNAP dollars at nearly $1.5 billion, with the next-highest totals garnered by Texas ($979.5 million), New York ($869.8 million), Florida ($618.7 million) and Illinois ($564.3 million).
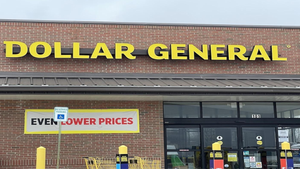
The latest retailer SNAP data from FNS (as of year-end 2021) indicate 254,350 participating locations. Numerator’s study revealed that SNAP consumers are 56% more likely to spend their CPG dollars at dollar stores, 24% more likely at convenience stores and 12% more likely at mass merchants versus non-SNAP consumers.

Source: Numerator “Helping SNAP Consumers During Economic Headwinds” report, March 2023.
Still, lower price increases have enabled regional and ethnic supermarkets to gain SNAP shopping trips, Numerator said in its report. Among the retailers seeing a rise in SNAP household trips are H-Mart (42% of projected trips), Market Basket (42%), Whole Foods Market (36%), 99 Ranch Market (35%) and Wegmans Food Markets (31%).
With food inflation remaining elevated, Numerator noted that SNAP users are shifting their food trips back to stores. Of those surveyed, 37% said they’re more likely to eat out four or more times per week. But as SNAP recipients scale back restaurant and foodservice spending, Starbucks, KFC, Burger King and Little Caesars are seeing the most lost trips, the study found.
Grocery stores would gain from more-inclusive online shopping and delivery programs, according to Numerator. Twenty percent of SNAP customers said they wish that grocery delivery services made it easier to use their program benefits. Currently, 12.9% of SNAP beneficiaries use Walmart , followed by DoorDash’s DashPass (5%) and Albertsons’ FreshPass (4.3%).
Under the SNAP Online Purchasing Pilot, launched by FNS in April 2019, 49 states (except Alaska) and the District of Columbia now allow SNAP beneficiaries to shop and pay for groceries online. Amazon, Walmart and Aldi are the only grocery retailers enabling SNAP online grocery shopping on a national scale. A number of chains, as well as Amazon, also accept SNAP EBT payments for online grocery orders, including through Instacart.

Source: Numerator “Helping SNAP Consumers During Economic Headwinds” report, March 2023.
The SNAP Emergency Allotment, initiated in March 2020, enabled all SNAP households to get an extra $95 per month in benefits, or an additional benefit up to the maximum for their household size, whichever was greater. Total SNAP benefits paid nationwide in 2022 came in at $113.74 billion (excluding program costs), with the average monthly benefit per person at $230.11, according to FNS data. Annual SNAP cost-of-living adjustments and the 2021 Thrifty Food Plan have lifted SNAP benefits to support a nutritious diet more reflective of current food costs.
Yet SNAP recipients are still experiencing food insecurity, Numerator said in its study. Twenty-six percent of SNAP consumers surveyed report being unable to buy enough food to feed their family.
Savings strategies employed by SNAP customers include fewer snack purchases and trading down to private brands. Units purchased per household have dropped in snack categories such as popcorn (-23.6% year over year), meat snacks (-18%), and snack seeds/nuts/trail mixes (-15.9%), the study said. And while private-label unit sales are down in general, Walmart, Aldi and Kirkland store brands are outperforming national brands. For example, Walmart’s Great Value unit sales are down 4% from a year ago, whereas branded unit sales have declined 20%.
Personal care and certain non-essential items, though, haven’t shown a marked pullback in SNAP consumer spending, Numerator said. Year-over-year unit sales per household are up or holding their own in categories like toothbrushes ( 6.3%), beer ( 4.6%) and face makeup (-0.5%), according to the report.
Of SNAP recipients surveyed by Numerator, 61% are in the bottom 30th percentile in terms of purchasing power, 45% have children (versus 28% of non-SNAP households) and 29% have five or more household members. Thirty-seven percent of respondents are Generation Z or Millennial. Also, SNAP households are twice as likely to be Black/African-American or Hispanic/Latino compared with non-SNAP households.
Numerator added that SNAP households are significantly more impacted by economic uncertainty. Seventy-nine percent of those polled said their financial situation is the same or better compared to the prior year. But one in five feel overwhelmed by financial burdens, and 56% are concerned about job stability (versus 31% of non-SNAP consumers). SNAP customers also are 3.8 times more likely to be disabled, the study found, and 56% more likely to not actively manage their health, compared with non-SNAP consumers.
About the Author
You May Also Like


.webp?width=300&auto=webp&quality=80&disable=upscale)