Stay up-to-date on the latest food retail news and trends
Subscribe to free eNewsletters from Supermarket News
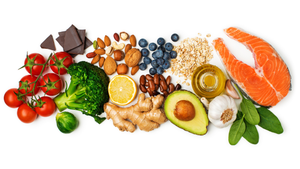
Consumers still choosing meat at higher percentage. Sales of meat alternatives have been up by double digits for 11 weeks, but the growth is not keeping pace with meat.
May 26, 2020

More than two months into the COVID-19 pandemic, the one constant has been the meat department’s powerhouse performance. But how have plant-based meat alternatives fared over the past 11 weeks? 210 Analytics and IRI partnered to understand the effect for frozen and fresh meat alternatives in dollars and volume throughout the pandemic.
Sales of meat alternatives (fresh plus frozen) have seen tremendous gains throughout March, April and the first two weeks of May. Sales gains vs. the same week in 2019 have been in the double-digits for 11 weeks running. Year-over-year sales gains peaked during the first of the two panic buying weeks with an increase of 157.8% vs. the same week in 2019. There have been small fluctuations, but sales gains have been around 70% since the last week of March. Volume sales have had a strong performance as well, with gains peaking the second of the two panic weeks, at 144.3% vs. the same week in 2019. Volume sales gains have trailed dollar gains since the onset of COVID-19 and the gap has widened in recent weeks. For the week ending May 10, the volume vs. dollar gain gap stood at 13.2 percentage points, signaling inflationary pressure.
Sales growth patterns of meat and meat alternatives over the past two months look very similar, with gains in plant-based meat alternatives exceeding those of the meat department each week. However, to fully understand the story behind the percentages, it is crucially important to look at the size of the market.
Despite robust sales gains each week, meat alternative dollar sales are a fraction of meat department sales. This means percentage gains are based on very different sales numbers and reflect very different absolute dollar gains.
Since the onset of the pandemic-related changes in grocery patterns, the meat department has seen an additional $5 billion in sales, vs. an additional $100.3 million for plant-based meat alternatives.
As a percentage of the total (meat department plus plant-based meat alternative sales), the share for plant-based alternatives stood at 1.5% during March 1. Because of the absolute gains in meat dollars, the market share for plant-based alternatives has since dropped to a low of 1.18% during the week of April 12 and stood at 1.27% the week ending May 10.
The volume share for meat alternatives shows a similar pattern. Despite percentage gains being higher, the absolute gains in pounds for meat vs. meat alternatives caused the share to drop during the pandemic. Meat alternatives presented 0.82% of total sales the first week of March and dropped to a low of 0.59% the week of April 12. The share for the week of May 10 stood at 0.70%.
Whereas the tightness in the meat supply has caused a drop in the average number of items carried per store—some weeks upwards of 40 fewer items—meat alternative assortment has stayed very stable throughout the pandemic. During the first week of March, plant-based meat alternatives represented 9.9% of the total number of items (combined average counts for meat and meat alternatives per store selling), while representing 1.5% of sales. During the week ending May 10, plant-based alternatives represented 10.8% of the total number of items, while representing 1.27% of sales.
Average Weekly Items Per Store Selling
| Category | 3/1/20 | 3/8/20 | 3/15/20 | 3/22/20 | 3/29/20 | 4/5/20 | 4/12/20 | 4/19/20 | 4/26/20 | 5/3/20 | 5/10/20 |
|---|---|---|---|---|---|---|---|---|---|---|---|
| Meat alternatives | 36.8 | 36.8 | 41.7 | 40.1 | 36.0 | 37.2 | 36.8 | 36.6 | 36.6 | 36.8 | 36.8 |
| Meat | 334.7 | 334.0 | 353.2 | 329.8 | 307.6 | 318.1 | 318.0 | 313.6 | 309.6 | 309.2 | 302.5 |
Source: IRI, total U.S., multioutlet, average weekly items per store selling
These past nine weeks have shown tremendous strength for plant-based meat alternative sales, even if its overall share vs. meat dropped slightly. The coming two weeks are critical in the process of establishing what the next several months will look like. Nearly all U.S. states have started to partially reopen or have plans to do so. The relaxation of these stay-at-home executive orders looks different from state to state and encompasses everything from the partial reopening of dine-in restaurants to the opening of hair salons and gyms to merely shifting from stay-at-home to safer-at-home. As states begin to enter their various reopening phases, the economic and social readiness of consumers to reengage with foodservice will become clearer. For the foreseeable future, it is likely that grocery retailing will continue to capture an above-average share of the food dollar.
Anne-Marie Roerink is principal of 210 Analytics, which specializes in research for the food retailing industry and authors studies in meat, produce, bakery, deli, frozen, confectionery, snacks and retail operations. She can be reached at [email protected].
You May Also Like