Stay up-to-date on the latest food retail news and trends
Subscribe to free eNewsletters from Supermarket News
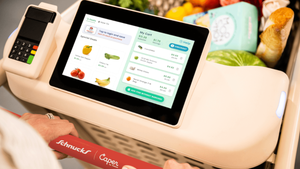
Grocery Price Index provides comprehensive product pricing trends.
November 10, 2021

Sponsored Content
Sponsored by Datasembly
There has been a dramatic change in the rate of grocery price inflation, making it necessary for brands, retailers and consumers to understand current, hyper-local pricing information and trends, in addition to National trends. The pandemic brought an unprecedented amount of price volatility into the market, and when combined with supply chain challenges and labor shortages, has resulted in significant price inflation that peaked in Q3 of 2021 and has continued into Q4—making the need for real-time competitive pricing intelligence more important than ever.
Leveraging a new Grocery Price Index that provides price information across 14 food categories, it’s evident that inflation is on the rise. The index can also be localized to see trends in 54 of the largest major metropolitan areas in the U.S. as well as by state dating back to October 2019.
Recent National Pricing Trends
There has been a dramatic change in the rate of grocery price inflation, starting in Q1 with an average monthly increase of .43%, to Q3 where the average monthly increase has nearly doubled to .83%. The Q3 increases alone surpass the USDA 20 year annual average. This inflation has continued into Q4, with October seeing an overall average increase of .85%.
Much of the October increase was propelled by meat and seafood:
Bacon & Pork – went up 2.13% and drove a large part of October’s increase
Meat & Seafoods - highest increase going up 1.81% overall for the month of October. This compared to the average monthly increase in Jan-Aug of .18%.
Local Price Inflation Trends
At the beginning of Q4, cities like Washington D.C, Atlanta, Seattle, Denver, Phoenix and Charlotte have seen some of the highest levels of inflation through the month of October and into November. Some of these local inflation price trends include:
Meat: large central metropolitan areas saw an October increase of 2.12% compared to a 1.27% increase in rural areas.
Bacon & Pork prices: rose 3.8% in Atlanta, 4.6% in Washington D.C, 7.2% in Charlotte, and 7.6% in Raleigh Durham major metro areas.
Seafood: prices rose over 5% in Denver, Phoenix, Portland, and Seattle metro areas
The Datasembly Grocery Price Index™ is a free tool providing additional insight into some of the volatile pricing trends, nationally and locally. The index leverages Datasembly’s unparalleled product data, which collects over two billion product prices daily, with hyper-locality that is second to none. It provides the broadest set of standard metrics for tracking and understanding pricing trends in the grocery industry. The Index measures weekly changes in pricing for grocery products using data collected from over 130,000 stores and over 180 retail banners that span over 30,000 zip codes across the United States.
The Grocery Price Index will be updated every week and is just the beginning of the detailed insights that are available using the Datasembly data. Data by specific retail banners and more granular category information are examples of what is possible leveraging the index
You May Also Like