SN Category Guide: Signs of Life for Many Products
Despite a lingering air of frugality left from the Great Recession, some food retail product categories exhibit improving trends, as shown in SN’s annual category review
The frugal grocery shopper is definitely not an endangered species.
Product unit volume at food retail is flat to slightly down over the past year, as consumers continue to shun large stock-up trips and are shopping on an as-needed basis, according to Susan Viamari, editor of the Time & Trends newsletter at Chicago-based Information Resources Inc.
“Consumers have that conservative approach — ‘I am buying what I need when I need it’ — vs. what they might have done in the past, which is maybe bought five of those boxes of cereal, for example,” she explained.
However, as detailed on the following pages in SN’s annual Category Guide, featuring data from IRI and the Nielsen Perishables Group, some categories across the store have exhibited varying degrees of growth, from portable, nutrient-dense foods in Center Store, to wellness products in nonfoods, and seafood in the perimeter fresh departments.
SN EXAMINES 50 KEY CATEGORIES
Supermarket dollar sales and percent change for the 52 weeks ending June 16, 2013, by Information Resources Inc., except for Fresh Market Perishables, sales in key U.S. grocery, mass/supercenter and club chains, including 18,000 stores nationwide for the 52 weeks ending May 25, 2013, by Nielsen Perishables Group.
 NONFOOD
1 Vitamins — $1.2B, 6.8
2 Soap — $1.1B, 1.5
3 Diapers — $918.2M, -4.1
4 Weight Cont/Nutrition Liquid/Powder — $871.1M, 6.3
5 Internal Analgesics — $803.4M, -0.3
6 Cold/Allery/Sinus Tablets — $771.1M, 6.7
7 Pet Supplies — $744.0M, 6.1
8 Toothpaste — $720.3M, -0.3
9 Cat/Dog Litter — $646.1M, 2.9
10 Gastrointestinal Tablets — $641.4M, -0.9
11 Shampoo — $628.7M, -0.7
12 Sanitary Napkins/Tampons — $625.7M, -1.2
13 Batteries — $570.1M, 4.1
14 Cough Syrup — $122.2M, 15.5
15 Sleep Remedies — $103.3M, 58.7
 FRESH MARKET
Dairy Aisle
1 Milk — $10.5B, -2.5
2 Natural Cheese — $8.1B, 1.6
3 Yogurt — $4.8B, 5.0
4 RFG Juices/Drinks — $4.3B, 2.3
5 RFG Fresh Eggs — $3.5B, 3.7
6 Breakfast Meats — $3.5B, 1.8
7 Luncheon Meats — $3.4B, -2.6
Perishables
8 Deli — $21.1B, 5.6
9 Fruits — $19.9B, 9.3
10 Vegetables — $18.1B, 4.0
11 Beef — $16.6B, 3.1
12 Poultry — $10.5B, 6.9
13 Bakery — $10.3B, 4.7
14 Seafood — $6.1B, 6.9
15 Pork — $4.8B, 1.4
 CENTER STORE
1 Carbonated Soft Drinks — $11.4B, -2.4
2 Fresh Bread and Rolls — $9.3B, -2.1
3 Salty Snacks — $9.0B, 2.7
4 Beer — $8.9B, 3.4
5 Wine — $6.6B, 4.2
6 Cold Cereal — $5.7B, -2.7
7 Frozen Dinner/Entrees — $5.5B, -4.5
8 Bottled Water — $4.4B, 4.1
9 Coffee — $4.3B, 4.7
10 Ice Cream/Sherbet — $4.3B, 0.4
11 Crackers — $4.1B, 2.8
12 Cigarettes — $4.0B, -5.1
13 Cookies — $3.9B, 3.0
14 Soup — $3.8B, 2.2
15 Chocolate Candy — $3.3B, 3.7
16 Bottled Juice — $3.2B, -4.3
17 Spirits/Liquor — $2.9B, 13.8
18 Peanut Butter — $1.2B, 10.6
19 Energy Drinks — $1.0B, 6.0
20 Premixed Cocktails/Coolers — $227.3M, -0.9
Although Viamari said she expects consumers overall to remain cautious and to continue to look for bargains and value, IRI’s most recent MarketPulse survey, released last week, showed that Millennials — people aged roughly 18 to 34, also known as Generation Y — have begun to express more positive sentiments with regard to grocery shopping.
IRI’s second-quarter Shopper Sentiment Index — which seeks to measure price sensitivity, brand loyalty and spending required to maintain a desired lifestyle — was the highest since the index was launched in the first quarter of 2011. With a benchmark of 100 as of Q1 2011, the latest survey put the Shopper Sentiment Index at 106, up from 103 in the first quarter of 2013.
The gain was driven mostly by Millennials, who continued to index below average but showed a sharp increase, to 94, in the second quarter. They had been indexing at around 85 since early 2012.
“Through our MarketPulse surveys over the past couple of years, we found that the Millennials were dragging the index down a little,” Viamari said. “Everyone was apprehensive and cautious, and not feeling great about their finances, but most of the groups were picking up in a somewhat northward direction. But those Millennials were really lingering.
“Now in the most recent two quarters, we are seeing that the Millennials are finally starting to pick up and catch up with the rest of the crowd as far as their sentiment.”
The report found that 28% of Millennials feel their financial situation has improved in the past year, vs. 20% of those aged 35-54 and 16% of those age 55 and older. In addition, 42% of Millennials expect their financial position to improve in the coming year, vs. 26% of those aged 35-54 and 17% of those aged 55 and older.
Retail Shifts
Jim Hertel, managing partner at consulting firm Willard Bishop, Barrington, Ill., explained how the ongoing pressures have played out in the retail landscape.
“Most consumers are still hurting to some degree,” he said, noting that the top 20% or so of income earners are an exception.
“The bottom 40% are challenged to find value, and to some degree must manage pinched household cash flow. They’re shopping dollar stores and other extreme-value formats,” he said.
“What’s going on in the middle is fascinating. Many who lost their incomes were forced to limited assortment stores — Aldi especially — and now they’re back at work, but realize they like Aldi as much or more than traditional supermarkets [due to on-par quality, the simplified shopping experience and great prices] and can’t see reasons to switch back.”
Looking ahead, Hertel said he expects that more traditional supermarkets might try to capitalize on some of the growth at the high end by offering more high-end product, although he cautioned that was only targeting a small slice of the overall population. In addition, he projected that Aldi would continue to grow “under the radar, and ultimately become noticed as a mid-tier player.”
Viamari noted that retailers need to think about competition in broader terms than discount retail.
“One of the biggest trends we are seeing right now in the grocery arena is the fact that the competitive landscape is really changing,” she said. “You have the dollar stores competing for share, and the drug stores, but there’s also more competition for overall ‘share of stomach’ from foodservice-type operations, so food retailers really have to think about where consumers are filling their stomach, not just where are they buying their groceries.”
Data Table: 300 Categories by Dollar, Unit Sales
Capitalizing on ‘Splurging’
As the economy slowly improves, Viamari said she thinks supermarkets are well positioned to take advantage of consumers seeking “small splurges” that fit within their budgets.
“Splurging these days might be buying a premium ice cream at the store, rather than going to the ice cream shop,” she explained. “Packaged goods are helping make that splurge more home-centered, and it is less expensive.
 “The grocery retailers have a great opportunity to remind consumers that they have products across the board that are still ‘splurges’ or special treats, but are a great value.”
One wild card in the outlook is always gas prices, Viamari noted.
“If gas prices keep going up, that could knock people down a peg,” she said.
In last week’s MarketPulse survey, 44% of shoppers said they are likely to cut spending on groceries if gas prices increase by 50 cents per gallon. In addition, 57% would make fewer, larger grocery-shopping trips; 52% would switch spending to stores that are closer to home; and 30% will switch spending to discount or club stores, even if those stores are a 15- to 20-minute drive.
 “What we have not seen yet is people saying, ‘Whoa, I had better stock up now, because then I can make less trips,’” Viamari explained. “People don’t have enough disposable income to take that liberty of traveling further to buy more, so that ultimately they are traveling less.”
She said overall IRI is “cautiously optimistic” about the direction of consumer sentiment in the months ahead.
“I would say we are cautiously optimistic that we are climbing in the right direction in terms of sentiment, but we are not thinking there will be any meaningful change in the near term in the way people approach grocery shopping.
“I do think people will remain conservative, and it’s still very important retailers that are talking to their shoppers about value, and offering the best value for their specific shoppers.”
— Mark Hamstra
Nonfoods: A Profitable Prognosis
Heightened interest in personal wellness has been a boon to several key nonfood categories, including nutrition drinks and vitamins.
Baby Boomers have helped propel sales of nutritional drinks, since this demographic group is not only buying these products for themselves, but also for their aging parents.
“As people age, they tend not to get as many nutrients in their diet, and Boomers realize this,” said Jim Wisner, president of the Wisner Marketing Group, Libertyville, Ill.
 Aiding category is the multiuse options for nutritional drinks, as many people use them not only as a dietary supplement, but also as a meal replacement.
“This makes sense, since the drinks are reasonable in terms of calories, and high in protein,” said Wisner.
Wisner predicts nutritional drinks will continue to see long-term, steady growth because they appeal not only to older consumers, but also parents with young children.
New Millennial parents are buying child nutrition drinks like PediaSure to supplement their children’s diets.
Millennials have much higher level of consciousness of what they’re feeding kids because they are information-hungry, and conduct in-depth research about the best way to keep their kids healthy, said Wisner.
While parents have always wanted their kids to eat right, Millennials are more adept at researching health news, and quickly acting on the information they gather.
 Along the same lines, there’s more awareness of the benefits of vitamins and supplements in preventing and treating certain diseases. For instance, research shows that B vitamins and other supplements lower the risks of macular degeneration and Alzheimer’s. On the supplement side, glucosamine can help ease joint pain caused by arthritis.
“There’s more specialized use of vitamins,” Wisner noted.
Retailers are tapping into the trend with programs like the Vitamin Finder, an online tool that matches Top Care private-label vitamins with specific lifestyles or health conditions. Meijer, D&W Fresh Markets, Stater Bros. and Big Y are among the chains involved.
“Retailers are becoming more proactive in terms of talking about vitamins as part of an overall health regimen,” he said.
 But heightened health care awareness is apparently having the opposite effect on dollar sales of another HBC category: internal analgesics. Dollar sales were a flat $803 million in supermarkets for the 52 weeks ending June 16.
Part of that has to do with the growth of private label. While consumers may have been leery of store-brand medicines years ago, the national-brand recalls from a few years ago forced them to try private labels. And many liked what they found. One in four over-the-counter medications consumers now purchase is a private label.
“People feel that since the FDA says generics are the same product, why should they spend an extra $3 for a national brand,” Wisner said.
Among other upward-moving nonfood categories, pet food is showing strength, increasing 6% to $744 million in dollar sales in supermarkets for the 52 weeks ending June 16.
While specialty stores like Petco have taken a bite out of the business, retailers are catering to pet owners with pet clubs, refrigerated pet food and premium private-label lines.
“Instead of rolling over, retailers have figured out a way to remain viable in the business,” he said.
Not all nonfood categories experienced positive dollar sales, however. Among others, diaper dollar sales dropped 4% in supermarkets to $918 million. This can be attributed, in part, to more online sales and declining birth rates.
But since the Generation Y group is so large, the category will pick up steam as Millennials’ biological clocks start ticking, and they have more job security, said Wisner.
— Carol Angrisani
Fresh Market: Well Adjusted
Prices are up again in perishable departments, but shoppers are saying the products are worth more money.
“Consumers continue to show that the fresh factor matters to them,” said Kelli Beckel, senior marketing manager at Nielsen Perishables Group.
 Beckel said that factors such as consumers seeking healthier lifestyles and retailers offering a better variety of fresh products indicate that “fresh has become a cultural shift, not a temporary fad.”
Consumers’ increasing interest in fresh can be seen in most of the perishable departments’ sales over the latest 52 weeks ending May 25. The Nielsen Perishables Group partnered with SN to provide sales information about in-store bakery, deli, fruits, beef, poultry, pork, seafood and vegetable categories.
 After several tough sales years, seafood has begun to see more popularity with consumers, gaining 7.5% in volume sales and 6.9% in dollar sales compared to a year ago.
“Seafood was a surprising standout this year. Seafood really struggled through the recession, facing the biggest sales declines of any fresh department at many points. But seafood sales made a comeback starting in 2012,” said Beckel, who notes that shoppers are becoming more willing to spend in fresh departments.
SN again continued its partnership with IRI for dairy categories including milk, cheese, yogurt, luncheon meat, breakfast meat, refrigerated juices and eggs.
 Yogurt continues to be a strong performer in dairy, growing 5% in the latest 52 weeks ending June 16.
While milk and lunch meats continue to lose sales this year, it’s still a positive picture for dairy categories.
Natural cheese, refrigerated juices, fresh eggs and breakfast meats all had sales gains in the supermarket channel. Interestingly, several categories — breakfast meats, refrigerated juices and yogurt — all had double-digit gains on the drug store channel. Despite the fact drug store sales represents a small slice of total sales for these categories, these sales indicate more consumers are looking to drug stores for food purchases.
— Jenna Telesca
Center Store: Capitalizing on Convenience
Portable foods that provide sustenance are among the standouts in Center Store as harried Americans balance frugality with the need to go, go, go.
Manufacturers are responding with portable solutions that pack a nutritional punch. One in four food and beverages on IRI’s New Product Pacesetter ranking of new products generating the highest revenue took a handheld or bite-sized form, and 40% were high in protein.
“There is an evolution in eating behavior driven by the fact that consumers are eating on the run, and because of the economy they’re opting for foods they can take from home,” said Sue Viamari, editor of IRI’s Times & Trends report.
 Increased snacking is spurring the trend, as Americans of all ages eat across morning, noon, afternoon, evening and even late night day parts. Crackers, cookies and salty snacks were among the beneficiaries during the 52 weeks ending June 16, with dollar sales up about 3% each in supermarkets. Breakfast and lunchtime staples cold cereal (-2.7%) and bread (-2.1%) didn’t fare as well, as quick-service restaurants and options like wildly popular Greek yogurt ate into their share.
While supermarkets increased unit sales in some Center Store categories, they lag the industry average in others like cereal, coffee, beer and chocolate, said Viamari, who pointed to dollar stores, convenience stores, online retailers and even quick-service restaurants that sell packaged goods.
 “Everyone is really competing for share of stomach and it’s going beyond traditional CPG retailers,” she said. “Starbucks and Dannon, for instance, formed a partnership to sell Dannon Greek yogurt in its [cafes].”
Consumers are after quick and easy satiety solutions but when it comes to at-home meal prep an increasing number seek customizable options that require simple steps beyond pressing start on the microwave. The availability of shelf stable meal kits that require the addition of fresh vegetables and/or proteins is stealing share from frozen dinners/entrees, whose sales dropped 4.5% in supermarkets.
Product innovations are likewise affecting sales of alcoholic beverages, but in a positive way.
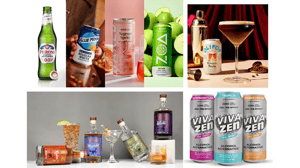
 Dollar sales of wine were up 4.2% during the 52 weeks ending June 16, thanks in part to new merchandising strategies designed to introduce Millennials to different varietals and price points. Self-serve and Skype-led tastings are building excitement within this core consumer group. In the beer category, growler pours and inventive craft brews boosted sales 3.4%, and vanilla, cotton candy and other dessert-flavored vodka and tequila, designed to appeal to the 20-something-year-old palate, helped drive liquor sales an impressive 13.8%.
— Julie Gallagher
Methodology
How the numbers are presented
The data on these pages were compiled from category sales figures at supermarkets provided by Chicago-based Information Resources Inc. for the 52-week period that ended June 16, 2013, and the Nielsen Perishables Group, West Dundee, Ill., in key U.S. grocery, mass/supercenter and club chains, including 18,000 stores nationwide, from the 52 weeks that ended May 25, 2013. Charts were compiled by SN intern Georgina Thermos.
 IRI data compare the sales performance of the top-selling supermarket categories to those categories’ performance in drug stores and a new multi-outlet geography tracked by IRI that includes supermarkets, drug stores, mass merchants (including Wal-Mart Stores), military commissaries, and select dollar and club chains.
Dollar sales and unit sales in supermarkets are presented for 227 categories tracked by IRI.
 SN provides detailed analysis of 50 categories representing large sales volume or high-growth areas in Nonfood, Fresh Market and Center Store.
Supermarket dollar volume is compared to drug and IRI’s multi-outlet geography for 42 of the categories at which SN takes an analytic look. Historical data are presented for years 2010, 2011 and 2012.
The eight perishable categories for which Nielsen provided data include historical figures for the most recent three quarters.
About the Authors
You May Also Like


